Drawing systems and processes
Drawing systems and processes
Each kind of system diagram answers one kind of question. An architecture diagram shows which parts exist and what depends on what. A sequence diagram shows the messages in one interaction, in order. A process map shows who does which work and where it goes next. A state diagram shows how one thing is allowed to change. The table below matches common questions to diagram types and links to the full article where there is one. The sections after it cover the notations involved, including UML, BPMN and C4, and the tools, including Mermaid and PlantUML.
The examples use a small invented repair service: customers request repairs in a browser, an API stores the requests, and a background worker sends notification emails.
Which diagram answers which question
| Question | Diagram | What a line means |
|---|---|---|
| What are the parts, and what depends on what? | Architecture diagram (C4 context, container, component) | Uses, calls, reads or publishes, with the relationship named |
| Who does what, and where does work go next? | Process map with swimlanes (BPMN or UML activity diagram) | The order of work, and the condition that picks a branch |
| Who sends which message, in what order? What if a reply never arrives? | Sequence diagram | A request, reply or event at one point in the interaction |
| What do our terms mean, and how many of one thing relate to another? | Domain model or ER diagram | An association with a count at each end |
| When is a change, such as cancellation, allowed? | State diagram | A transition, labelled with its event, guard and effect |
| Where does information come from and where does it go? | Data-flow diagram (below) | The information being moved |
| What does the customer see, and what happens behind it? | Service blueprint (below) | Customer actions against front-stage and backstage work |
| Which outcome follows from several conditions? | Decision table (below) | No lines: one row per combination of conditions |
| When did each event happen, and how long did it take? | Timeline (below) | Position on a time axis |
| Why does a problem keep growing? | Causal-loop diagram (below) | One quantity influencing another |
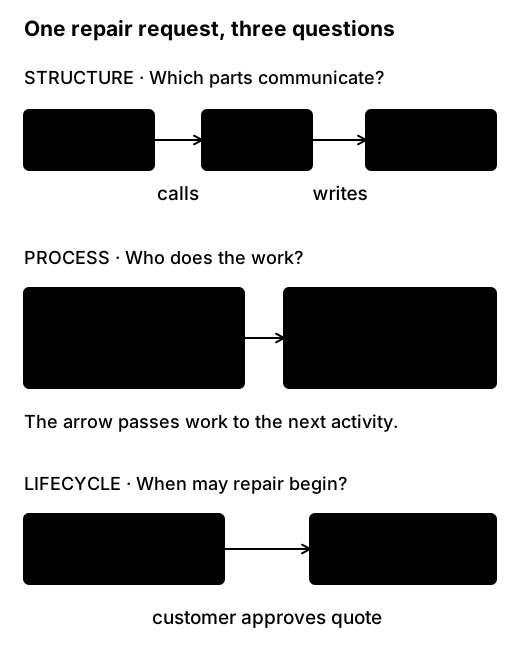
Some questions need two diagrams. If the API accepts a request and a worker sends the email later, the architecture diagram shows where the worker sits, and the sequence diagram shows whether the browser gets its response before the email is sent.
Architecture diagrams and C4
The C4 model splits architecture diagrams into four zoom levels. A context diagram shows the system among its users and the external systems it talks to. A container diagram opens the system to show its applications and data stores. A component diagram opens one container, and a code diagram opens one component. Most teams only need the first two or three. C4 is the name of the model, not of its fourth level, so if someone asks for a “C3 diagram”, ask which level and which question they mean.
C4 also has supplementary diagrams. A system landscape shows several systems together. A dynamic diagram numbers the interactions for one scenario, which overlaps with a sequence diagram. A deployment diagram shows which instances run where. Zooming further into the code never reaches the servers, so deployment needs its own diagram. The architecture article covers choosing a zoom level, naming relationships, and keeping structure and deployment apart. The C4 introduction is the original description.
Process maps, swimlanes and BPMN
A process map shows the activities in a piece of work, the decisions between them and who does each one. Swimlanes give each role a row, so a line that crosses lanes is a handoff: the repair request leaves the coordinator and reaches the technician.
BPMN (Business Process Model and Notation) is the standard notation for process maps:
- A pool is a participant, and lanes divide it into roles.
- Solid sequence flows order the work inside a pool, and dashed message flows run between pools.
- Gateways split and join paths. An exclusive gateway takes exactly one branch, a parallel gateway takes all of them, and an inclusive gateway takes one or more.
A UML activity diagram with partitions draws much the same thing and suits teams already using UML. A workshop sketch can use simpler conventions, but if you call the drawing BPMN, keep BPMN’s meanings. The process article builds a swimlane diagram from a discovery map, then adds choices, parallel work, waiting and cancellation.
Sequence diagrams
Use a sequence diagram when the question is about order: which message comes first, who waits, and what happens if a reply never arrives. Each participant has a vertical lifeline, whose events happen in order from top to bottom, and each arrow is a request, reply or event. Framed fragments mark alternatives (alt), optional steps (opt), repetition (loop) and parallel work (par).
An architecture diagram can’t answer questions like these. For example, does the browser receive its receipt before the notification job runs? What does the worker know if the email provider never replies? The sequence article writes each example in Mermaid, and its companion on failure and asynchrony draws a timeout that looks the same whether the request was lost, the reply was lost or the provider was slow.
Domain models and ER diagrams
A domain model (or conceptual model) names the things a business talks about and how they relate: a customer has repair requests, and a repair request has appointments and quotes. An entity-relationship (ER) diagram draws the same kind of relationships, usually closer to a database design.
Cardinality says how many of one thing can relate to another. It is written at each end of the line: 1, 0..1, 0..* or 1..* in UML-style notation, or with crow’s-foot symbols in many ER tools. A domain model isn’t a schema. It says one request can have many appointments, and leaves keys and tables to a later design. The domains article uses UML-style counts and covers names, identity, cardinality and the step to a schema.
State diagrams
A state diagram, or state machine, shows the states one thing can be in and the transitions allowed between them. A repair request might move from Submitted to Diagnosing, Awaiting approval, Approved, In repair and Completed. Each transition is labelled event [guard] / effect: what happened, the condition that must hold, and the work done when the transition is taken.
State diagrams answer rule questions. Can a customer cancel after approving a quote? What happens when a cancellation and the start of repair work arrive together? The states article also puts the same rules in a state table, where a missing combination of state and event is easier to spot.
Data-flow diagram
A data-flow diagram (DFD) follows information between external entities, processes and data stores. Its arrows are labelled with the data that moves, such as “contact details” or “appointment notice”. They show information moving, not steps in time.
Threat modelling draws trust boundaries on a DFD and examines every flow that crosses one. For the repair service, the recipient address and message text cross from the notification worker to an external email provider. The domains article contrasts a small DFD with the domain model. OWASP’s threat modelling process shows how DFDs are used in security analysis.
Service blueprint
A service blueprint lines up what the customer does against the front-stage actions they can see, the backstage work they can’t, and the support processes underneath. The line of visibility separates what the customer sees from the rest.
Use a service blueprint when the question is about the customer’s experience across channels. For example, the customer sees “We will contact you soon” while the request waits in an unassigned queue. The process article includes a compact blueprint.
Decision tables, timelines and causal-loop diagrams
A decision table replaces a tangle of branches when an outcome depends on several conditions at once. Each condition gets a column, such as warranty status, appliance type or location, and each meaningful combination gets a row with its outcome. Add an explicit row for unknown values. The process article shows a gateway for a simple choice and a table for a decision with several inputs.
A timeline places events on a time axis. Use real timestamps for incident reviews, and mark estimated times as estimates. A sequence diagram’s vertical spacing doesn’t measure elapsed time, so a request that waited overnight needs a timeline.
A causal-loop diagram shows how quantities influence each other. Each arrow is marked + when both quantities move in the same direction and − when they move in opposite directions. A loop with an even number of − links is reinforcing, and one with an odd number is balancing. For example: a growing repair backlog increases pressure to rush diagnosis, rushing causes rework, and rework grows the backlog. That loop is reinforcing. Each arrow is a proposed influence, so treat the loop as a hypothesis to test.
Diagram types, notations and tools
Diagram types, notations and tools are easy to confuse:
- A diagram type decides what the drawing is organised around: structure, messages over time, work, or the life of one thing.
- A notation gives marks defined meanings. UML defines about fourteen diagram types, including class, sequence, state machine, activity, component and deployment diagrams. BPMN covers process diagrams. C4 is a set of architecture zoom levels that can be drawn in any box-and-line notation.
- A tool makes and maintains the drawing. Mermaid and PlantUML turn text into diagrams, so the source can live in a repository and be reviewed like code. GitHub and GitLab render Mermaid directly in Markdown, while PlantUML runs on Java and covers more of UML. Structurizr defines one architecture model in text and generates C4 views from it.
- Other tools draw by hand. draw.io is a manual diagram editor with shape libraries, including UML and BPMN, and connectors that stay attached. Excalidraw is a whiteboard-style editor with a hand-drawn look. IBM Blueworks Live supports process discovery and modelling.
Choose the diagram type from the question, the notation from who will read it, and the tool from how the drawing will be maintained. The maintenance article covers choosing a tool, and the Mermaid syntax reference lists the diagram types Mermaid supports.
Whiteboarding
At a whiteboard, start by writing the question at the top, such as “What happens after a customer requests a repair?”, and mark whether you’re drawing the current system or a proposal. Use plain labelled boxes for every software part until you need more. Name each line as you draw it, so people can correct a wrong arrow while it’s still cheap to change.
Three articles cover live drawing. Drawing at the whiteboard covers running the board during a conversation. A whiteboard shape vocabulary gives quick shapes for users, services, stores and queues, and comes with a printable reference. Layout, labels and five colours covers arrangement and a colour scheme that still works in a black-and-white photo.
The articles
Each article stands alone. This is the suggested order:
- Architecture diagrams: C4 zoom levels, relationships and deployment.
- Processes and swimlanes: activities, handoffs, BPMN gateways, waiting and cancellation.
- Sequence diagrams: calls, replies, fragments and reading a design, in Mermaid, with a companion on failure and asynchrony.
- Domains and data relationships: terms, identity, cardinality and the step to a schema.
- States and lifecycles: states, events, guards, effects and state tables.
- Drawing at the whiteboard: building a shared drawing during a conversation.
- A whiteboard shape vocabulary: quick shapes and a consistent drawing style.
- Layout, labels and five colours: arrangement, labels and colour that survives a photograph.
- Keeping diagrams useful: tools, decision records and when to update a diagram.